HAR published its report on 2022 home sales in Houston. Let’s review how Houston’s real estate performed.
Single-Family Homes

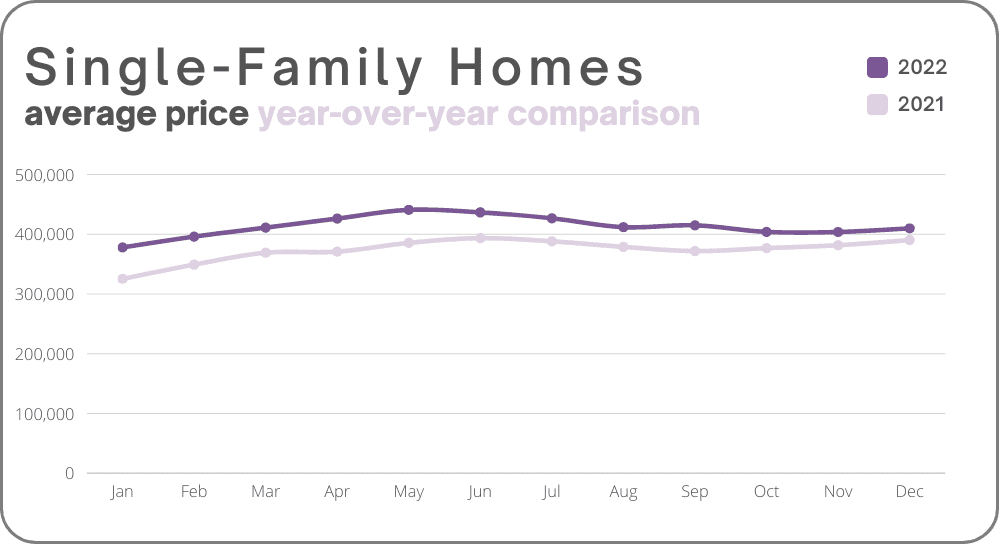
Units Sold and Price Comparison for December 2022
| November 2022 | MoM Change | December 2022 | YoY Change | |
| Single-Family Home Sales | 5,827 | +8.6% | 6,378 | -32.6% |
| Single-Family Average Sales Price | $403,589 | +1.5% | $409,777 | +5.1% |
| Single-Family Median Sales Price | $332,000 | -0.6% | $330,000 | +3.8% |
Broken out by pricing, here’s how December 2022’s real estate sales performed:
- :$1 – $99,999: decreased 22.3 percent
- $100,000 – $149,999: decreased 29.1 percent
- $150,000 – $249,999: decreased 42.8 percent
- $250,000 – $499,999: decreased 29.7 percent
- $500,000 – $999,999: decreased 19.6 percent
- $1M and above: decreased 34.8 percent


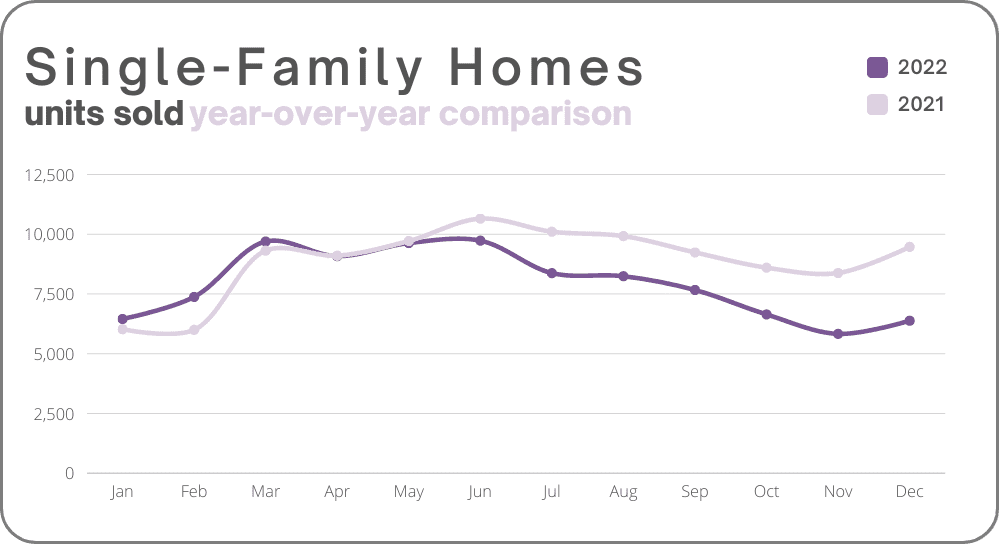
Year-Over-Year Comparison of Units Sold
| Jan. | Feb. | Mar. | Apr. | May | Jun. | Jul. | Aug. | Sep. | Oct. | Nov. | Dec. | |
| 2022 | 6,451 | 7,372 | 9,693 | 9,079 | 9,627 | 9,728 | 8,370 | 8,241 | 7,664 | 6,641 | 5,827 | 6,378 |
| 2021 | 6,024 | 5,997 | 9,309 | 9,100 | 9,714 | 10,649 | 10,102 | 9,918 | 9,235 | 8,597 | 8,374 | 9,467 |
| YoY Change | +7.1% | +22.9% | +4.1% | -.02% | -.09% | -8.6% | -17.1% | -16.9% | -17% | -22.8% | -30.4% | -32.6% |

Condos & Townhomes

Units Sold and Price Comparison for December 2022
| November 2022 | MoM Change | December 2022 | YoY Change | |
| Units Sold | 437 | +.2% | 438 | -46.1% |
| Average Price | $253,551 | -6.6% | $241,502 | -6.4% |
| Median Price | $218,000 | -2.3% | $214,999 | -2.3% |
Have questions about renting, buying, or selling in the Houston and near-town areas? Get in touch with Circa Real Estate. They’d love to chat with you about how to make your real estate dreams a reality.
